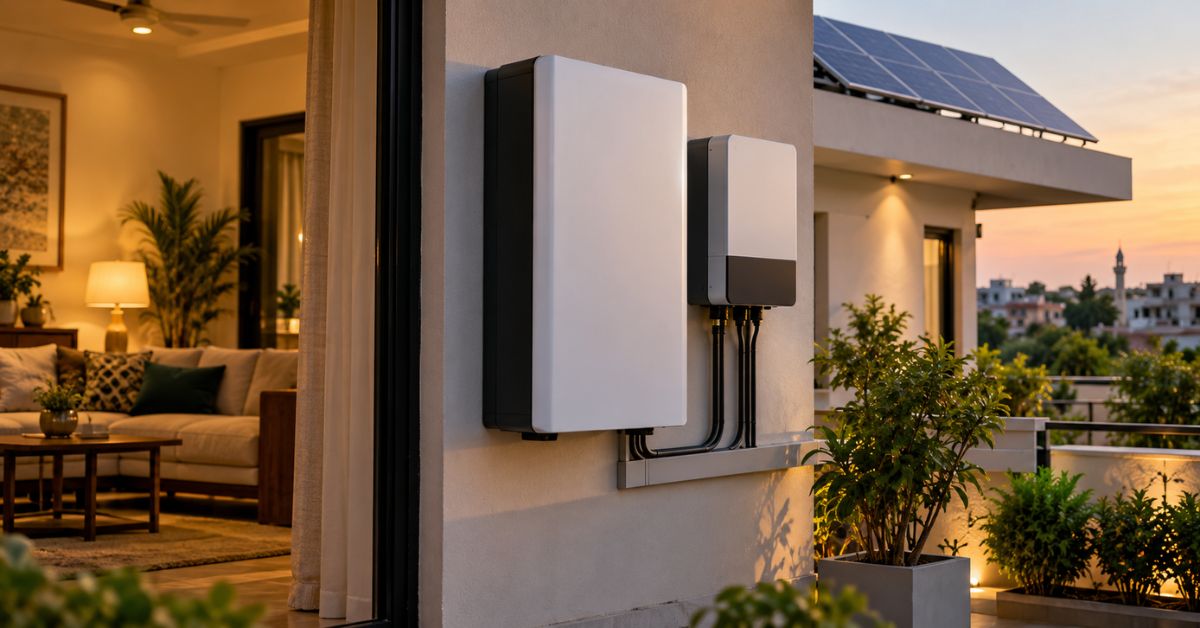

For initial planning in Pakistan, a 5kWp solar panel array can be estimated at 20–25 units a day if its expected annual-average yield is 4–5 units per installed kWp per day. That works out to 600–750 units over 30 days.
Your roof’s actual output can be higher or lower. Location, season, shading and system operation all affect the result.
Daily, Monthly and Yearly Generation Estimates
One electricity unit equals one kilowatt-hour (kWh). The figures below use 5kWp of installed panel capacity and the stated yield assumption.
Period | Calculated generation |
|---|---|
Average day across the year | 20–25 units |
30-day equivalent | 600–750 units |
Annual equivalent, using 365 days | 7,300–9,125 units |
A 30-day equivalent is useful for a first comparison. It is not a forecast that every month will produce the same amount.
For a purchase decision, request separate estimates for all 12 months. Their total provides a more useful annual figure for your property.
Check What “5kW” Means in Your Quotation
A 5kW inverter does not confirm that 5kWp of panels are installed. The inverter rating and combined panel rating need to be stated separately.
Calculate panel capacity by multiplying panel quantity by individual wattage, then dividing by 1,000. Use that panel total when discussing expected generation.
Also check whether the quoted units refer to solar production, electricity supplied to household loads, or electricity exported. These are different measurements, particularly when batteries are included.
Two packages carrying the same inverter rating can therefore produce different daily totals.
How the Generation Calculation Works
The planning calculation is:
Daily units = installed panel capacity in kWp × expected daily yield per kWp.
Using an assumed yield of 4.5 units per kWp per day:
5 × 4.5 = 22.5 units per day, averaged across the year.
The yield figure should reflect the location, proposed equipment and operating losses. It represents expected electricity output, rather than the number of daylight hours.
When a forecast already includes inverter, temperature and other losses, avoid deducting another blanket loss percentage. Ask which losses are included before adjusting the result.
Why the Inverter Does Not Show 5kW All Day
The live power reading changes as sunlight changes. Output generally rises after sunrise, reaches its stronger period during suitable daylight conditions, then falls towards sunset.
A brief high reading does not establish the day’s energy total. Check the accumulated daily kWh instead.
Panel direction can also change the shape of the generation curve. An east-and-west arrangement may spread production differently from an array facing one direction.
The useful comparison is the whole day’s energy, followed by the monthly total.
Expect Output to Change With the Season
Shorter winter days and a lower sun can reduce the energy available to the array. Cloud, haze and rainy periods can also lower daily totals.
Summer has longer days, but high panel temperatures reduce power output compared with cooler panels receiving the same sunlight. The hottest day is not automatically the highest-production day.
Your city’s weather and your roof conditions both matter. A clear roof in one location should not receive the same forecast as a shaded roof elsewhere.
Use a monthly generation estimate for the planned panel direction and tilt. Avoid judging a winter month against an annual-average daily figure.
Roof Conditions and Maintenance Affect Real Output
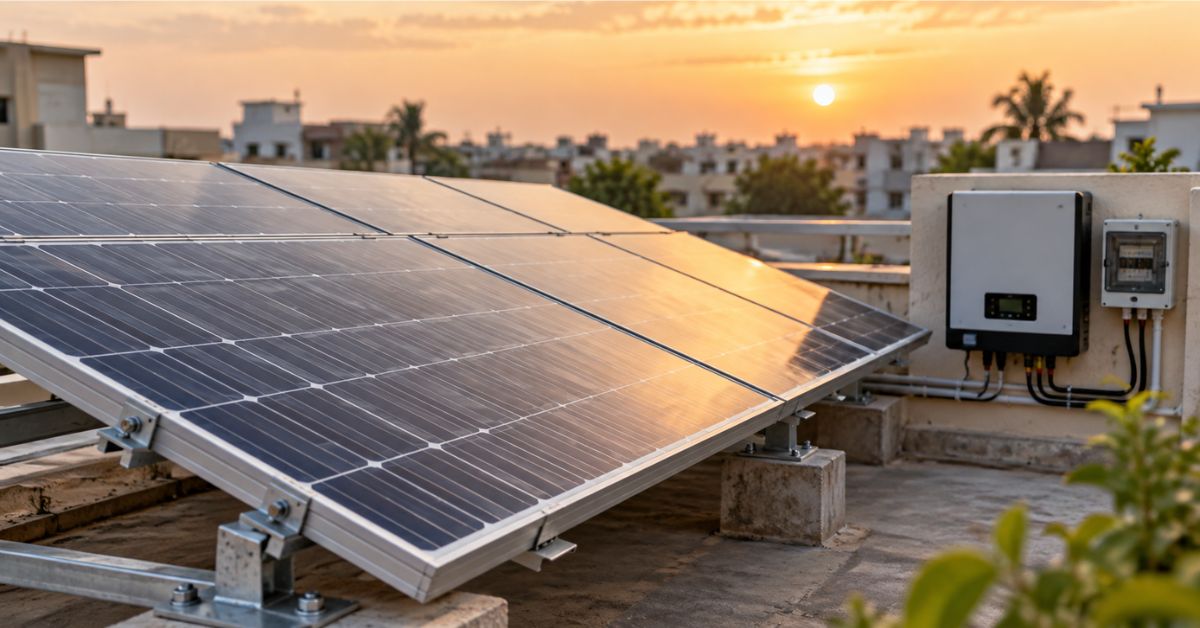
Water tanks, staircase rooms, nearby buildings and trees can cast moving shadows. Their effect depends on the time of day and season.
Dust and bird droppings reduce the sunlight reaching the cells. Cleaning needs depend on the location and surrounding conditions, rather than one fixed schedule for every home.
Loose connections, equipment faults and inverter warnings can also affect recorded production. A lower total should be investigated before assuming more panels are needed.
Through our solar maintenance service, Japston Energy reviews generation records, inverter readings, alerts and previous output data to help identify problems.
Load Shedding and Export Limits Can Reduce Generation
A standard on-grid inverter normally shuts down when grid power fails. Daytime outages can therefore reduce the units generated even when sunlight is available.
A hybrid installation needs the correct equipment and backup configuration to continue operating during an outage. Its output still depends on connected loads, charging demand and system limits.
Generation can also be restricted when export is limited and the home cannot use or store the available energy. This is why an unrestricted production estimate may exceed the electricity actually recorded.
Ask whether the forecast allows for these operating conditions.
Check the Correct Monitoring Reading
Use the solar or PV generation total in your monitoring system. Confirm what that field measures, especially on a hybrid installation.
Battery discharge is stored energy supplied later. Adding it to solar generation can count the same solar energy twice.
Grid exports are also only part of the picture. Solar electricity used directly inside the home may never appear in the exported-units total.
Record daily generation, monthly totals, outages and inverter warnings. Compare results with the forecast for the same month, while accounting for unusual weather.
If a drop continues across comparable conditions, share the records with your installer.
Get a Forecast for Your Roof Before Buying
A solar site survey and design assessment should connect the output estimate with the actual panel layout.
Japston Energy reviews installation area, sunlight, shading, electricity use and equipment requirements during its assessment. These details help establish a suitable design.
Request the panel capacity, inverter rating, monthly generation forecast and included loss assumptions in writing. Clarify whether the estimate represents available production or generation after export and operating restrictions.
Plan With an Estimate, Then Verify with Records
Use 20–25 daily units as an initial calculation only where a 4–5-unit daily yield per installed kWp is appropriate. Confirm the monthly pattern before choosing equipment.
Share your city, roof details and electricity bills with Japston Energy to plan a home solar system around your property. After installation, monitoring records provide a stronger basis for maintenance and future expansion than a package label or one high-production day.
FAQs
Is 25 units the maximum a 5kW system can generate daily?
No. It is the upper end of the illustrative annual-average range used here. Individual days can be higher or lower.
Will adding a battery increase generation?
It does not increase panel capacity. It may absorb surplus energy that would otherwise be restricted, but charging and discharging also involve losses.
Can a 5kW system cover 700 monthly units?
It may generate a similar monthly amount under suitable conditions. Daytime production, evening consumption and applicable billing arrangements still determine how much grid electricity you buy.
Do exported units show my total solar production?
No. Electricity used directly in your home is separate from exports. Check the dedicated solar-generation reading for total production.
Should I add panels after a low-production week?
First check weather, shading, outages, settings and faults. A short low-output period does not establish that the array is undersized.